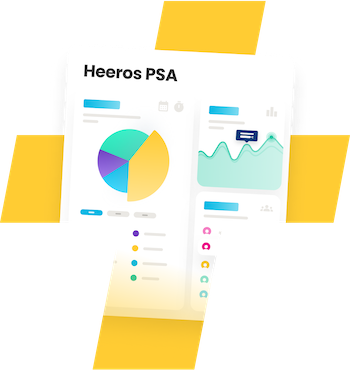
The best reporting features on the market
Discover Heeros PSA's reporting features that are exactly how they should have always been: intuitive, flexible, and tailored to our customers' needs. User-friendliness and unlimited customization options set us apart from competitors. See the difference for yourself - try it now and take your reporting to a new level with Heeros PSA!

Experiences with reporting
The revamped reporting has already received widespread positive feedback....
Why choose reporting as part of the Heeros PSA software?
With Heeros, you get the best reporting features on the market as part of the Heeros PSA system - and at a smart price, in all our packages. Read and find out how our reporting elevates expert and project business to new heights.
Add and save your own report templates

Share your reports with others
By sharing essential reports with the right people and teams within your company, you significantly streamline daily operations. Reports are created once and can then be easily shared with colleagues at your preferred level of access.

You can create ready-made graphs and export data to Excel
In Heeros PSA's reporting, you can also create ready-made visual graphs to use, for example, in presentations. Additionally, you can always export data from the PSA software to Excel if you need to work on it further elsewhere. The data can be exported in the same format and selections as it appears in the PSA software. This might sound like a given, but not all software can do this.
Watch Digi-CSM Saara's video on PSA reporting features
Reporting features in Heeros PSA
With the following table, you can compare the reporting features available in different packages of Heeros PSA - Growth, Business, Enterprise, and Enterprise+.
Reporting
Growth
Business
Enterprise
Enterprise+
Save your own reports
Share reports with other users
Notifications
Grouping of report data by any dimension
Filtering of report data by any dimension
Pivoting of report data
Generation of graphs from report data
Export reports in CSV or Excel format
Reporting based on all data in the software

Reporting - Frequently Asked Questions
Can reports be pivoted?
Reports can be easily pivoted directly within the PSA software. By pivoting, you can rearrange a table to your desired format, such as organizing billing months into their own columns, and with a few clicks, you can view billing by customers on a monthly basis.
Are reports customizable?
With PSA's reporting tool, you can create reports that are tailored to your needs. You can choose from a wide variety of columns, filter and group data based on each column, and even pivot the table into your desired format. No more combining multiple reports or collecting data from multiple sources.
Can I create images from reports within PSA?
You can generate graphs and images directly from the report data in the table. Simply select the desired dataset, create the graph, style it, and conveniently download the image to your computer, for example, for presentation purposes.
Can I share the reports I create within our company?
In what format can data be exported from the system?
Do I need to combine reporting data outside of PSA or can I get the desired information directly in the same data run?
Are there any limitations or things that cannot be done in reporting?
How is reporting included in different pricing packages?
How can I test the reporting feature?
Read more from our expert articles
Learn more from our numerous articles!
